Table 20 shows the statistics pane. It presents various game results in calendar form. Two types of statistics are distinguished:
- Quiz Statistics
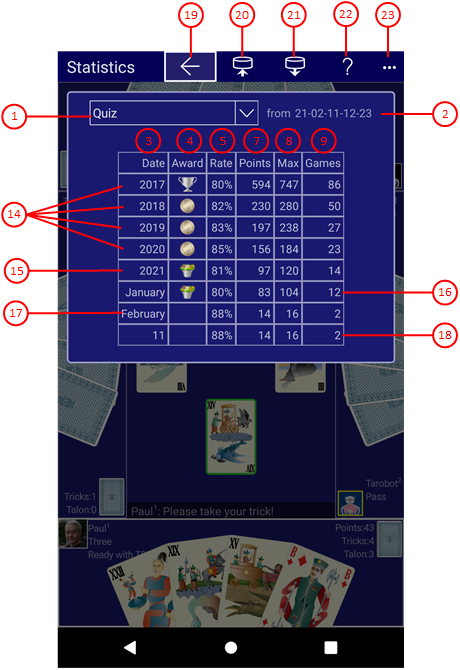
Quiz statistics are generated based on the quiz games performed. The rating results from the answers to the quiz questions asked.
- Game Statistics
With version 2021.09 of KubiTarock the game statistics was introduced. The statistic includes all games that have been played until the end of the game. When the game results are determined, a data record for the statistics is also generated. This record contains the game type and a player rating if the game was announced by the system user or if the system user was called in the game. If the system user has controlled more than one player in a game, only the first player is included in rating.
- For each game that the system user's player has announced or been called in, a target score is determined that they must achieve in order to get the 100 percent success rate. The target score is determined based on the current rule set and is the game score without additional bonuses.
- The statistics data are created together with the game results. If you go back after displaying the game results with Undo, the statistic data will be removed from the statistics. You can use this, for example, to prevent bad games from being included in the rating.
- If you still have archived games that were created before the statistics were introduced, you can still include them. You can do this as described here.
- For each game that the system user's player has announced or been called in, a target score is determined that they must achieve in order to get the 100 percent success rate. The target score is determined based on the current rule set and is the game score without additional bonuses.
The current quiz and the game statistics are loaded when the app is started and automatically saved when the app is suspended. However, from the Archive, statistics can also be generated for other players and displayed here.
When you click any circled number in the picture below, the browser will scroll to the explanation of the numbered item. To return to the picture, click the back button.
| Figure 57: Statistics - All Games | |
| Figure 56: Statistics - Quiz | Figure 58: Statistics - Specific Game |
The game results are summarized in periods. The smallest period is the day, the middle is the month, and the greatest period is the year. Only for the last month the results are kept per day. The results of the previous months in the last year are collected per month and the results of previous years are summarized per year.
-
Statistics
Here you can select the type of statistics:- Quiz
shows the results of the quiz games performed (figure 56).
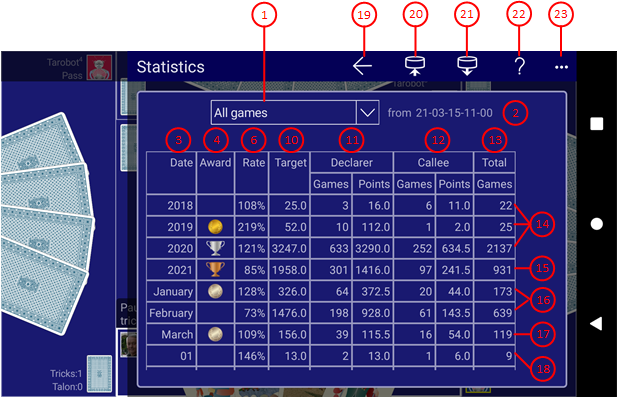
- All games
shows the summary of all games performed (figure 57).
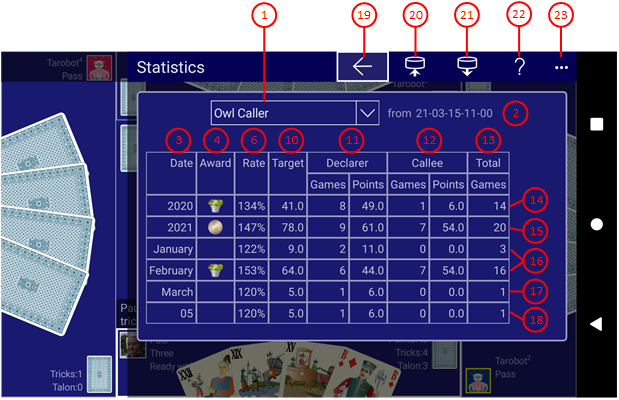
- Special game
shows the results of a game you selected from the list. In figure 58 the results of the Uhu Caller games are shown.
- Quiz
- Creation date
of the statistics.
- Period
This column specifies the period to which the quiz results in this line refer.
-
Award
This column shows the award you earned during the period. The following tables are showing the requirements for the awards.
- Rate quiz game
Success rate in the period r = Max / Points * 100%.
- Rate specific game or all games
Success rate in the period r = Target / (Declarer Points + Callee Points) * 100%.
- Points
Points achieved in the period.
- Max
Maximum achievable points in the period.
- Games
Performed quiz games in the period.
- Target
Target points for the success rate 100%.
- Declarer
Declarer games played and points achieved.
- Callee
Callee games played and points achieved.
- Total
Total games played as declarer, as callee, or as opponent.
- Past years
The results of past years are summarized in one line each.
- Current year
The results achieved in the current year are summarized here additionally.
- Past months
The results of past months in the current years are summarized in one line each.
- Current month
The results achieved in the current month are summarized here additionally.
- Days
The results on the days of the current month are summarized in one line each.
 If you click this button, the pane previously shown is made visible again. If no previous pane exists, the current overlay pane disappears only. Alternatively, you can press the Alt+Left-Arrow key combination.
 Press this button if you want to save the statistics shown to a file. You can freely select the saving location.
 Press this button to locate and open another statistics file to be shown.
 Press this button if you want to use the statistics displayed as the current statistics. If, for example, your current statistics could not be loaded, you can select an older statistic in the Statistics files overlay pane. It is then displayed here and you can use it as the current statistic.
 Click this button to overlay the game view with the help pane showing online information about the current view content. Alternatively, you can press the F1 key on the keyboard. The help function can be used only if an internet connection is available.
-
 If the current width of the game view does not allow to display all primary commands of the app bar as buttons, the overhanging commands are moved to the list of secondary commands. That list can be opened by pressing this button. Pressing this button also causes the app bar to be displayed in its maximum size. When in maximum size, the app bar shows a description below each button shape. The list of secondary commands is divided into the following sections:
- If primary commands had to be moved due to insufficient width, these are displayed first. This is followed by a horizontal dividing line.
- This is followed by commands for all subsequent overlay panes with which they can be called up directly.
- If an overlay pane provides special commands, these are listed after another dividing line.
- Finally, there is a “<--” command with which you can close the current and all previously displayed overlay panes.